 MakoPulse
Two continents · 30-second checks · Real browsers · AI diagnosis
Know it's down before your customers do.Without the false alarms.
MakoPulse checks your sites from the US and Europe as often as every 30 seconds — in a real browser when it matters. When something breaks, AI diagnoses the root cause within a minute, your phone rings, and your status page keeps customers in the loop — automatically.
Free plan · no card required
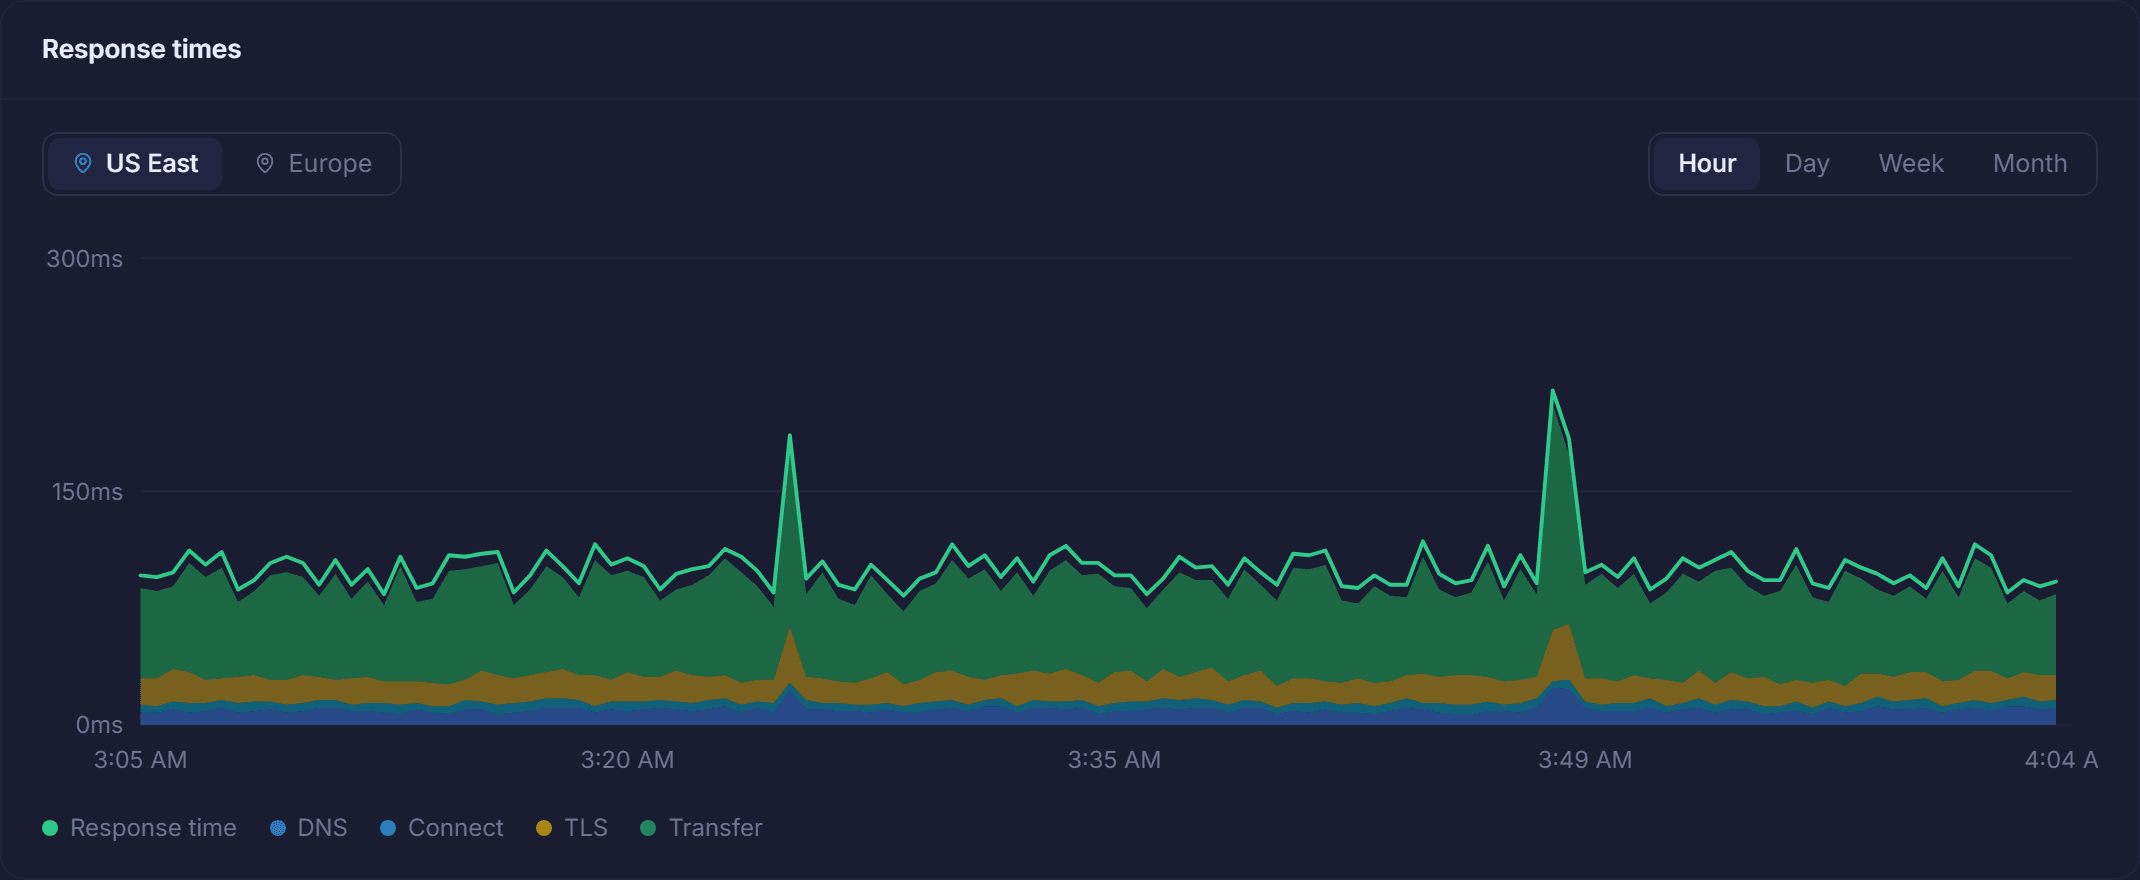
Phase timing · US + Europe
See why it's slow, not just that it is
Every check is broken into DNS, connect, TLS, and transfer time — stacked right on the chart. A slow DNS provider, an overloaded server, and a fat page all look identical as a single number; they look completely different here.
Flip between the US and Europe with one click to see what each side of the Atlantic actually experiences — and whether that slowdown is your site or just one region's routing.
AI diagnosis · Sixty seconds · Nothing to install
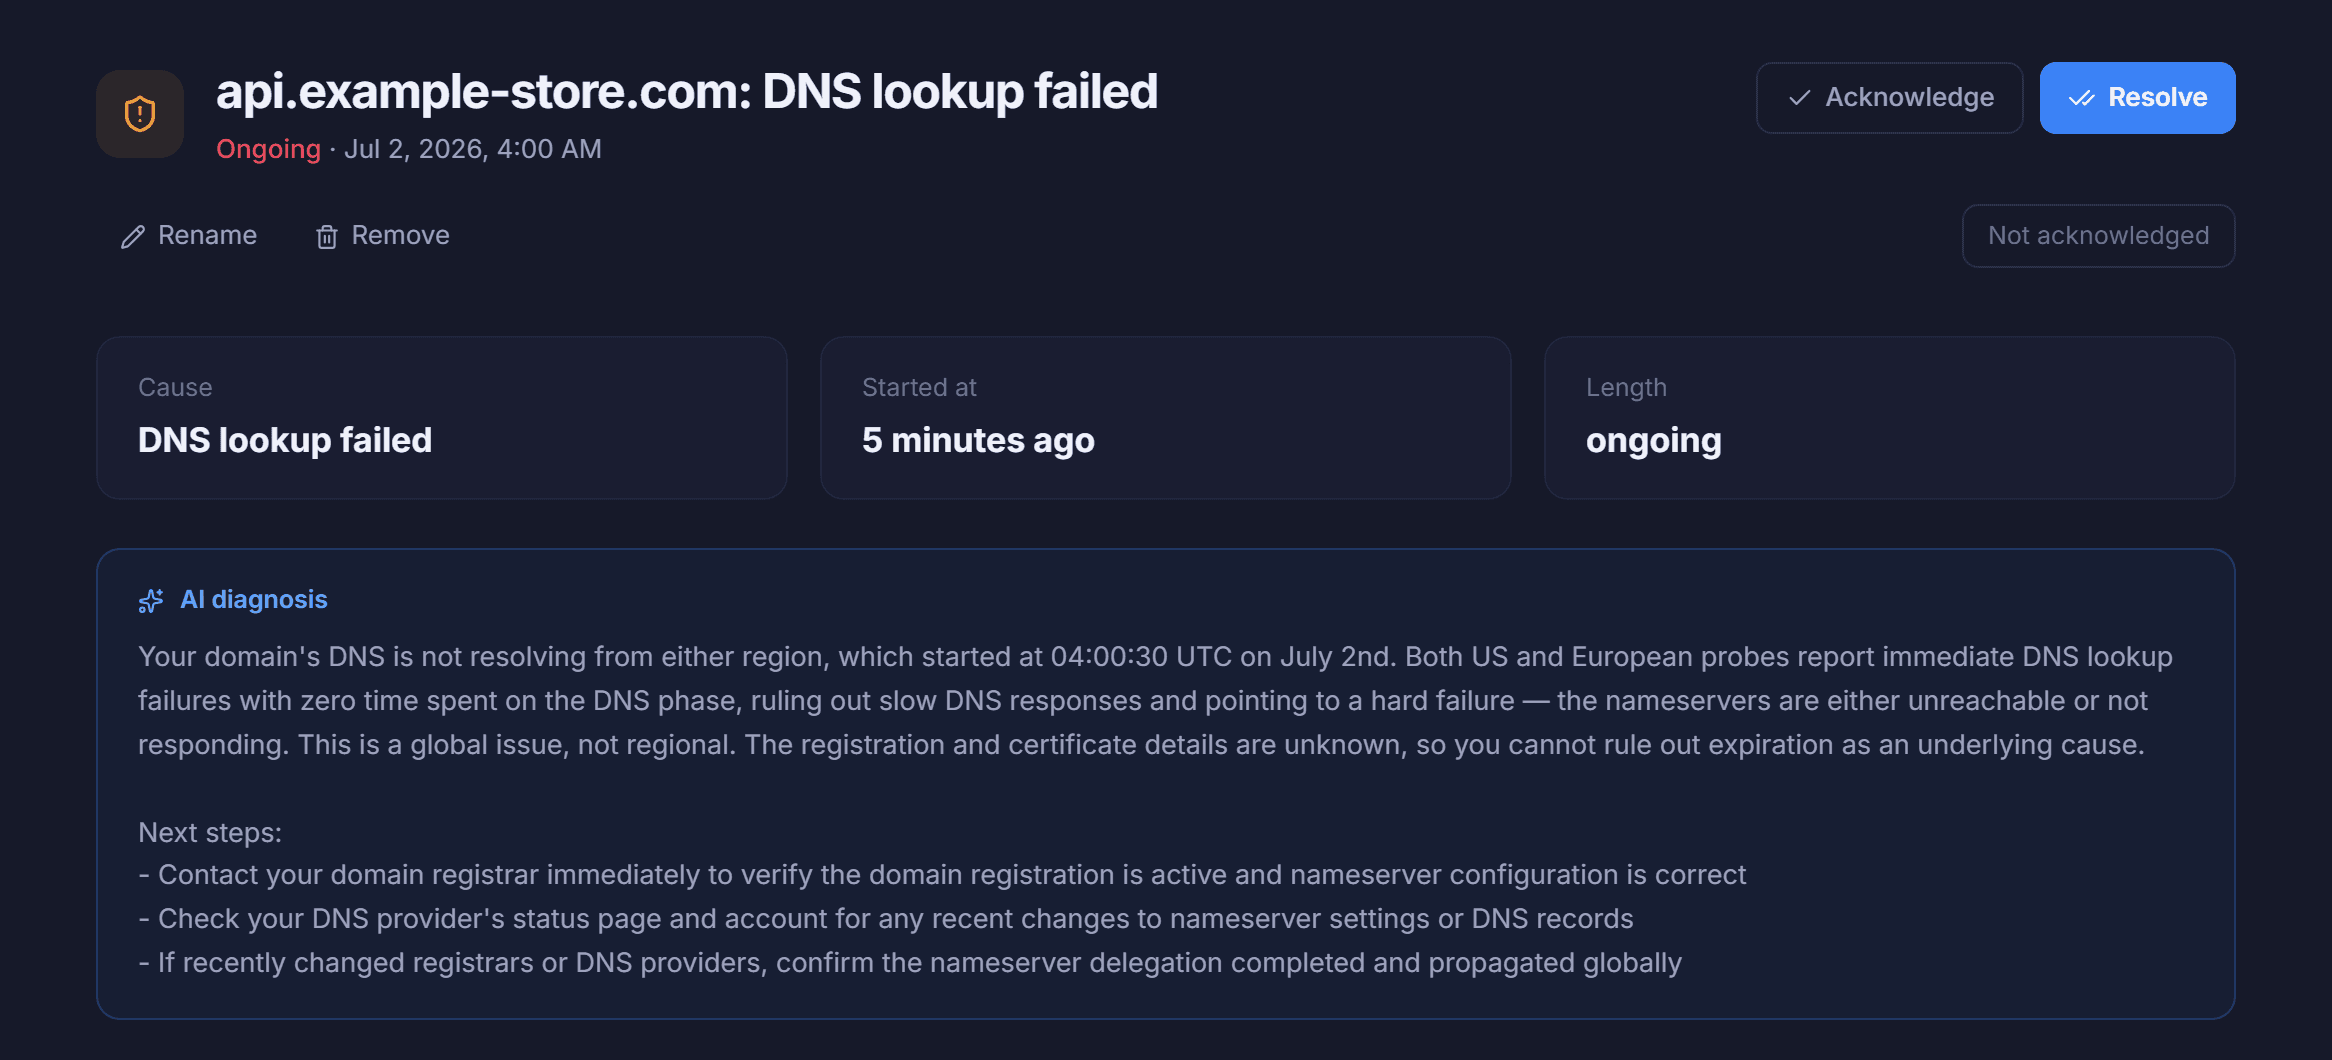
The AI investigates while you're still waking up
The moment an incident opens, MakoPulse re-probes your site from both regions, runs a traceroute, and inspects DNS, certificates, and response history. Within about a minute the incident carries a plain-English root cause — and the two or three things to actually do about it.
Other tools call this an “AI SRE” — but only after you pipe them every log and metric you produce, and pay to store it. MakoPulse needs a URL. It diagnoses from the outside, the way your customers actually reach you, and it works a minute after you sign up.
- No log shipping, no agents, no instrumentation to set up
- Sees outages from two continents — which a log never can
- AI post-mortems write themselves when the incident resolves
Everything watching, one place
The whole incident lifecycle — multi-region detection, AI diagnosis, alerting, escalation, and the status page that keeps customers calm.
Checked from two continents
Every monitor is probed from the US and Europe. Per-region response charts tell you instantly whether an outage is global or just one side of the Atlantic.
Checks every 30 seconds
Seven monitor types — HTTP, keyword present or absent, status code, real ICMP ping, TCP port, and full browser — at cadences down to half a minute.
Real-browser checks
A headless Chrome loads your page like a visitor would and alerts on JavaScript errors and broken rendering that a plain HTTP 200 happily hides.
AI diagnosis in the first minute
The moment an incident opens, MakoPulse re-probes from both regions, runs a traceroute, checks DNS and certificates, and posts a plain-English root cause with next steps.
See why it's slow
Response times break down into DNS, connect, TLS, and transfer phases — so "the site is slow" becomes "your DNS provider is slow" before you start guessing.
Alerts that actually wake you
E-mail, SMS, and a phone call that reads the alert aloud. Unacknowledged incidents climb a timed escalation ladder until a human responds.
Incidents that resolve themselves
A failed check opens an incident, alerts go out, and recovery closes it automatically — with a timeline, an AI post-mortem, and who acknowledged.
Heartbeats for cron jobs
Backups, imports, scheduled workers — give each one a ping URL and get alerted the moment a job quietly stops running.
Branded status pages
A public, no-login page with live state, 90 days of uptime history, incident history, and e-mail subscriptions — under your brand.
Built because of a false alarm
MakoPulse exists because another monitoring tool sent a dozen SSL-expiry warnings in one day — for certificates that renew themselves. Our checks understand auto-renewing hosts and stay quiet unless expiry is genuinely close. When MakoPulse pages you, it means something.
Confirmation periods filter out network blips, incidents deduplicate instead of stacking, and recovery closes the loop without you touching anything.
What a quiet day looks like
- Checks from the US and Europe, down to every 30 seconds
- TLS certificates and domain expiry inspected continuously
- Auto-renewing hosts: no noise until it matters
- Zero alerts sent — because nothing broke
Your status page is already running
Every MakoPulse account ships with branded public status pages — live component state, 90-day uptime bars, incident history, and e-mail subscriptions for your customers.
View the live Mako Logics status pageSimple pricing
Start free. Upgrade when you need faster checks, real-browser monitoring, and a bigger fleet.
Free
$0/month
- 5 monitors, checked every 3 minutes
- Uptime, SSL & domain-expiry alerts
- 1 branded public status page
- Incident timelines & e-mail alerts
Pro
$15/month
- 50 monitors, checked every 30 seconds
- Real-browser checks that catch JavaScript errors
- Multi-region checks (US + Europe) with phase timing
- AI incident diagnosis & post-mortems
- 5 status pages · 10 team members · SMS & phone-call alerts